Saturday, September 8, 2012

Obama - Are You Really Better Off? Obama Gay Marriage, Obama Lies How Obama Parses Words


See other gifts available on Zazzle.

Obama - Are You Really Better Off? Obama Gay Marriage, Obama Lies

How Obama Parses Words
Yes, 96,000 American jobs were added in August, which Obama admin appraises
as a drop in unemployment, but when one figures in the 368,000
who stopped looking for work , the unemployment rate really rises to 8.4%, according
to the US Bureau of Labor Statistic and Daily Mail.Most, mainstream media, like the
Obama administration
has not reported the full facts.
The 69.9 per cent labor force participation rate for men is at lowest level recorded
since the US government began tracking it in 1948
According to James Pethokoukis of the American Enterprise Institute, the unemployment
rate would be 11.2 per cent if the labour force participation rate had remained what it
was when Obama took office in January 2009. The U.S. Labour Department also said that
41,000 fewer jobs were created in June and July than previously reported.
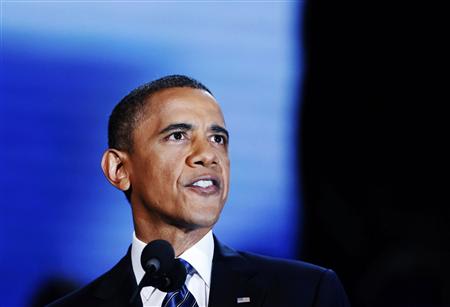
President Barack Obama was made aware of the figures before he took the stage to deliver
his prime-time address at the Democratic convention on Thursday night, which
could account for his sometimes grim demeanour as he spoke, according to Daily Mail
Obama's address came at Democratic Convention thrusday, Sept 6, which wasswitched from a
74,000-seater stadium to a 20,000-seater arena
ostensibly because of the weather but amid indications there were problems filling seats,
brought the three-day democratic convention to a close.
A 'phantom' roll call early in Thursday's proceedings to put back 'God' and pro-Israel sentiment
in the protocol after political pressure, took three votes, all of which appeared to show
anti-God sentiment in the majority - not the two-thirds 'pro-go ' majority needed.
Yet, it was, obviously , predetermined to keep
God in the platform as an immediate affirmative or God was finally given
after the third voting. A hail of boos followed the change.
President Obama, seeking to quell criticism from Republicans and pro-Israel groups,  directed his party to restore language declaring Jerusalem Israel’s capital:
http://www.nytimes.com/2012/09/06/us/politics/pushed-by-obama-democrats-alter-platform-over-jerusalem.html 


See other gifts available on Zazzle.
Read more: http://www.dailymail.co.uk/news/article-2199815/Obamas-DNC-2012-speech-Bleak-unemployment-numbers-morning-Obama-tells-DNC-problems-solved.html#ixzz25ogxXfT6
Stalling: The growth of new jobs has taken a significant dip compared to the beginning of the year
Hourly pay fell
386,ooo dropped out of labor force,
meaning 96,000 fewer working is meaningingless
96 mill men working is the lowest since 1948
23 months in a row with unemployment above 8 %.
Remember admin promised that if we passed stimulus bill
unemployment would be in the 5%
23 mil underemployed
when you add in those who ga e up, it would be 14%
= 14% of people not working
Obama and media only tell you that the unemployment is down
without looking at these other important factors...
'No amount of data can help you understand'- Mrs Obama tues nite speech

Obama - Are You Really Better Off? Obama Gay Marriage, Obama Lies

OBAMA ACCOMPLISHMENTS, OBAMA BIRTH CERTIFICATE - OBAMA’S ECONOMY BY THE NUMBERS


See other gifts available on Zazzle.


I've had all the change I can stand!

OBAMA ACCOMPLISHMENTS,

OBAMA BIRTH CERTIFICATE -

OBAMA’S ECONOMY BY THE  

NUMBERS     


 23,136,000: The Number Of Americans Who Are Unemployed, Underemployed, Or Have Stopped Looking For Work. (Bureau Of Labor Statistics, Accessed 9/7/12)
12,544,000: The Number Of Unemployed Workers. (Bureau Of Labor Statistics, Accessed 9/7/12)
8,031,000: The Number Of Workers Working Part-Time For Economic Reasons. (Bureau Of Labor Statistics, Accessed 9/7/12)
5,033,000: The Number Of Workers Who Have Been Unemployed For 27 Weeks Or Longer. (Bureau Of Labor Statistics, Accessed 9/7/12)
1,043,000: Construction Jobs Lost Since President Obama Took Office. (Bureau Of Labor Statistics, Accessed 9/7/12)
582,000 Manufacturing Jobs Lost Since President Obama Took Office. (Bureau Of Labor Statistics, Accessed 9/7/12)
368,000: Workers That Dropped Out Of The Labor Force In August. (Bureau Of Labor Statistics, Accessed 9/7/12)
261,000: Jobs Lost Since President Obama Took Office. (Bureau Of Labor Statistics, Accessed 9/7/12)
41,000: Downward Revision Of Jobs Created Over The Last Two Months. (Bureau Of Labor Statistics, Accessed 9/7/12)
15,000: Manufacturing Jobs Lost In August. (Bureau Of Labor Statistics, Accessed 9/7/12)
1981: The Last Time The Labor Force Participation Rate Was At Its Current Level Of 63.5 Percent. (Bureau Of Labor Statistics, Accessed 9/7/12)
43: Consecutive Months The Unemployment Rate Has Remained Above Eight Percent. (Bureau Of Labor Statistics, Accessed 9/7/12)

39.2 Weeks: The Average Duration Of Unemployment – Nearly Double The 19.8 Weeks When President Obama Took Office. (Bureau Of Labor Statistics, Accessed 9/7/12)
14.7 Percent: The Real Unemployment Rate, Including Those Who Are Working Part-Time Due To Economic Reasons.Includes t hose who have given up looking for jobs (Bureau Of Labor Statistics, Accessed 9/7/12)  (Many have helped swell the ranks of those on food stamps (40 million plus) and other government assistance under Obama, that may contribute to not encouraging people to look for jobs-editor's note(
11.2 Percent: The Unemployment Rate Had Labor Force Participation Remained Steady Since President Obama Took Office. (American Enterprise Institute, 9/7/12)
8.4 Percent: The Unemployment Rate Had Labor Force Participation Remained Steady From July. (American Enterprise Institute, 9/7/12)
8.1 Percent: The Unemployment Rate In August. (Bureau Of Labor Statistics, Accessed 9/7/12)
7.8 Percent: The Unemployment Rate When President Obama Took Office. (Bureau Of Labor Statistics, Accessed 9/7/12)
5.4 Percent: The Unemployment Rate President Obama’s Advisers Predicted If We Passed His $787 Billion Stimulus. (Christina Romer and Jared Bernstein, “The Job Impact Of The American Recovery And Reinvestment Plan,”1/9/09)

See other gifts available on Zazzle.
http://www.RoadToSuccess.us/blog

OBAMA ACCOMPLISHMENTS, OBAMA BIRTH CERTIFICATE - OBAMA’S ECONOMY BY THE  NUMBERS

WHAT HAS OBAMA DONE, OBAMA TWITTER, OBAMA SPEECH


WHAT HAS OBAMA DONE, OBAMA TWITTER, 

OBAMA SPEECH


See other gifts available on Zazzle.

A scorecard on the economy under Barack Obama

By Louis Jacobson
Published on Friday, June 1st, 2012 at 4:01 p.m.


See how the economy has changed since Obama was elected in 2008. See how the economy has changed since Obama was elected in 2008.
In the hotly contested presidential campaign between President Barack Obama and Mitt Romney there is one undisputed point: the central issue is the state of the Americaneconomy.
End of agreement.
Were the country’s economic troubles deeper than expected when Obama took office in January 2009? Were his ideas and actions effective in righting the nation’s economic ship? Are things getting better? If so, are they getting better fast enough?
From both parties, the political rhetoric will be contentious for the next five months and, by its very nature, oversimplified. But below the fury there are objective metrics as to how the economy has performed on Obama’s watch and where it stands today.
PolitiFact.com, the independent fact-checking operation of the Tampa Bay Times, has produced a scorecard — key economic measures to track where the economy stood a year before Obama took office, where it was when he assumed power and how it has trended through May 2012.
We’ve gathered statistics for everything from corporate profits to the price of ground chuck. To help you see which ones are up or down, we’ve shaded most of the statistics from white (the most positive number) to dark (the least positive).  We offer figures for 2008, 2009, 2010, 2011 and 2012 — either an annual figure for the whole year or the monthly figure for January of that year. We also added a column for the most recent figures available.
Some analysis suggests the mixed record that most Americans feel:
• Gasoline prices, the rate of poverty, food stamp use and the federal debt are worse today than when the president took office.
• The unemployment rate, personal income and the stock market turned worse but are improving.
• Corporate profits, mortgage rates and the level of consumer debt are better today.
But the point of the scorecard is for you, the voters and consumers of political speech, to have factual measures by which to judge what you hear. The perspective you bring to it is all yours.
About these charts
To help you see how the numbers trend, we’ve shaded the statistics from white (the most positive number) to dark (the least positive). We haven’t shaded the numbers for government jobs because of differing opinions over whether more government employment is helpful to the economy.

Jobs

2008200920102011January
2012
April/May
2012
Unemployment rate5%7.8%9.7%9.1%8.3%8.2%
Broader unemployment rate “U-6″9.2%14.2%16.7%16.1%15.1%14.8%
White unemployment rate4.4%7.1%8.7%8.1%7.4%7.4%
Black unemployment rate9.1%12.7%16.5%15.7%13.6%13.6%
Hispanic unemployment rate6.5%10%12.6%12%10.5%11%
Total private-sector jobs115.6 M111 M106.8 M108.2 M110.5 M111 M
Total government jobs22.4 M22.6 M22.5 M22.2 M22 M22 M
Median weeks unemployed910.720.121.721.120.1

Income

2008200920102011January
2012
April/May
2012
Yearly GDP$13.2 T$12.7 T$13.1 T$13.3 T$13.5 T
Disposable personal income per capita$33,229$32,166$32,481$32,667$32,677
Personal bankruptcies1,074,2251,412,8381,536,7991,362,847
Poverty rate12.5%13.2%14.3%15.1%
People receiving food stamps32 M39 M44 M46 M46 M

Homes

2008200920102011January
2012
April/May
2012
Median home sale price$232,400$208,600$218,200$240,100$221,700$235,700
New homes sold in that month44,00024,00024,00021,00023,00033,000
Existing home sales, annualized4.2 M3.8 M4.2 M4.5 M4.6 M4.6 M
Foreclosure starts0.88%1.08%1.2%1.27%0.99%0.96%

Business

2008200920102011January
2012
April/May
2012
Corporate profits$1.2 T$1.4 T$1.8 T$1.9 T
Bank failures251401579261
Corporate bankruptcies43,54660,83756,28247,806
Industrial production100.487.487.492.596.597.4
Consumer confidence87.337.456.564.861.564.9
Dow Jones Industrial Average13,0449,03510,58411,67112,39712,393
Labor productivity103103109110111

Prices

2008200920102011January
2012
April/May
2012
Overall inflation4.3%0%2.6%1.6%2.9%2.3%
Food and beverage inflation4.8%5.2%-0.4%1.8%4.4%3.1%
Loaf of white bread$1.32$1.40$1.36$1.40$1.42
Pound of ground chuck$2.78$2.99$2.84$3.07$3.32
Gallon of milk$3.84$3.34$3.21$3.39$3.53
Pound of apples$1.28$1.11$1.07$1.13$1.18
Pound of sugar$0.51$0.57$0.63$0.66$0.71
Gasoline prices$3.16$1.74$2.72$3.12$3.36$3.73
Residential natural gas per unit$12.24$12.49$10.56$9.79$9.55$9.40

Debt and savings

2008200920102011January
2012
April/May
2012
Personal savings rate5.4%5.1%5.3%4.7%3.9%
Outstanding credit card debt$948.5 B$955.5 B$856.2 B$794.7 B$800.8 B$803.6 B
Household debt rate18.4%18.5%17.4%16.2%15.9%
Mortgage rates5.76%5.06%5.03%4.76%3.92%3.91%

Federal government

2008200920102011January
2012
April/May
2012
Federal discretionary spending as percent of GDP7.9%8.9%9.4%9%8.5%
Federal mandatory spending as percent of GDP11.1%15%13.3%13.5%14.4%
Annual federal deficit$458 B$1.41 T$1.29 T$1.3 T$1.33 T
Cumulative public debt$5.14 T$6.37 T$7.81 T$9.39 T$10.45 T$10.95 T

WHAT HAS OBAMA DONE, OBAMA TWITTER, 

OBAMA SPEECH